Official maps that show which parts of Vancouver Island are at highest risk of flooding have not been updated in at least two decades and are difficult for people to use, says the author of a 2019 research paper that analyzes floodplain maps across Canada.
University of Waterloo associate professor Jason Thistlethwaite says these outdated, inaccessible maps make it difficult for individuals and municipalities to make proper evacuation and risk management plans in the event of disasters like the one that struck BC this past week.
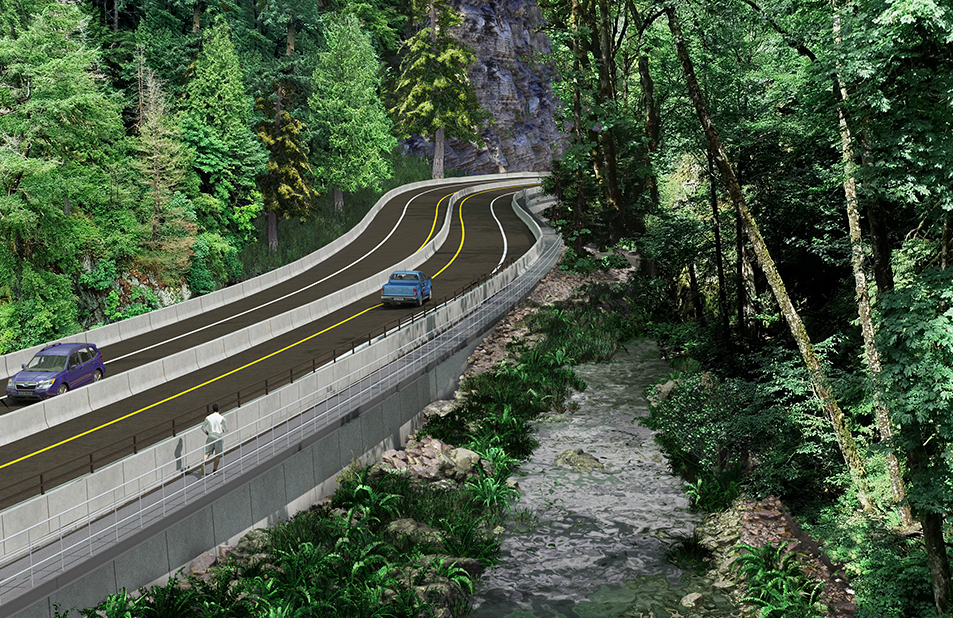
Historic amounts of rainfall along BC’s south coast over the weekend of Nov. 12 brought devastation and tremendous loss to thousands across the Lower Mainland, prompting the province to announce a state of emergency. The immediate impact on southern Vancouver Island was far less destructive, but flooding and mudslides along key highways like the Malahat created dangerous travel conditions with little warning for commuters.
This most recent flooding is a snapshot of what’s to come, with experts attributing the devastation to climate change and predicting heavier rainfalls in the future. But, according to Thistlethwaite and his colleagues’ research, there have been over 80 other significant flood disasters across Canada since 2000, and rebuilding after extreme rainfall alone cost more than $20 billion between 2003 and 2012.
Flood risk isn’t evenly distributed across the province—and particularly in urban environments it’s not always clear where the greatest risk lies.
“Internationally, the main tool that property owners, municipalities, and provinces use to guide resources and better understand the risk involves the use of flood maps,” said Thistlethwaite, an author of the 2019 paper. “So we were curious about the state of flood maps in Canada. If you were a property owner, and you wanted to identify what your risk is, how would you go about doing it?”
The group spent six and a half weeks doing what any concerned citizen would do if they wanted to know their level of flood risk: they Googled the names of municipalities known to be at high risk of flooding—designations that were established by the federal government in the 1970s through a program called the Flood Damage Reduction Program (FDRP)—along with “flood maps” to see what came up.
They then rated each community’s map based on a list of nine criteria, including how easy it would be for a layperson to find the map online, locate where their property lies on it, and assess their own level of risk.
The paper analyzes maps from 369 high flood risk communities, including 86 in British Columbia. According to Thistlethwaite, the maps in BC met fewer of the group’s criteria for what constitutes a good map than those in places like New Brunswick and Alberta.
Sooke's floodplain map, printed in 1995. Other maps date back to 1979 or earlier.
The BC government website for floodplain maps shows there are 17 regions on Vancouver Island federally designated as flood risk areas. These maps were all created between 1979-97 and have not been updated since, despite advances in the interim in geospatial technology and new knowledge about climate change-related risk, as well as major changes on the ground.
A look at this map tells Thistlethwaite that it would be very difficult for a non-expert to figure out where things are, or where their own property is located.
“The [maps] are very old. Property has changed. There [are] developments in areas that didn't exist before,” he said. “There's sort of a thick line that represents the floodplain. It's very difficult to identify any other geographical markers that would give you a sense of whether or not you were at high risk of flooding.”
For an example of a good floodplain map, Thistlethwaite points to the City of Calgary, which boasts a map that was updated in 2013 because of a push from the city following that year’s devastating floods. It’s easy to see the difference: Calgary’s flood map website is comprehensive and offers a user-friendly, interactive grid map.
A screenshot of Calgary's flood map, one of several interactive maps on the city's website.
These maps, originally created through the FDRP, play several roles in personal and community risk management, but have been largely ignored by Canadian municipalities, who have allowed developers to build without consulting the maps.
“The reason why we have flood risk is that we have allowed settlements and development in high-risk areas,” Thistlethwaite said.
He adds that flood maps are one way for the public to hold governments accountable for allowing development in high risk areas. This is only possible when they are easy for people to find and understand.
“Individuals [and] anyone concerned could have a look at a flood map and get an idea of whether critical infrastructure is at risk,” he said. “You could use that information to then go to governments and demand that they manage the risk and [take] the structural measures… but also non-structural measures such as communicating risk warnings.”
Having access to transparent maps would also help people who own or are looking to buy property to figure out how best to protect themselves and their belongings from floods in the future.
The best morning read in Victoria, bar none.
Stay connected to your city with the Capital Daily newsletter.
By filling out the form above, you agree to receive emails from Capital Daily. You can unsubscribe at any time.
While the floodplain maps of BC are relatively easy to find—just Google “flood map BC” and the province’s website pops up with links to maps in each region—Thistlethwaite and his colleagues found that the site is less easy to navigate and uses outdated software that often can’t be processed by modern web browsers.
Since the paper was published, Thistlethwaite says there has been some indication that work is being done, at the federal level, to update floodplain mapping across the country.
In a mandate letter to the Minister of Natural Resources in December 2019, Canadian Prime Minister Justin Trudeau outlined a commitment to work with provinces, territories, and Indigenous Peoples to complete flood mapping across the country. An update in May 2021 said Environment Canada is working to strengthen policy and science related to flood mapping, and develop a national standard for mapping.
The CRD has taken steps of its own to assess flood risk, but its most current work, updated in November, deals specifically with risk from sea level rise and tsunamis—water coming in from the ocean, not down from the sky. Still, unlike the existing floodplain maps, those models do take into account modern satellite elevation data and climate projections.
There is not currently a publicly announced timeline for when these updated standards and modernized maps will be completed, and whether or not they will be made available to the public in an accessible way.

.jpeg)
.jpg)


.jpg)